In this warmer activity, you will learn about the structure, task requirements and language needed to write a task 1 report on pie charts for the IELTS writing exam. Review and the sample task and sample answer and answer the questions to complete the warmer.
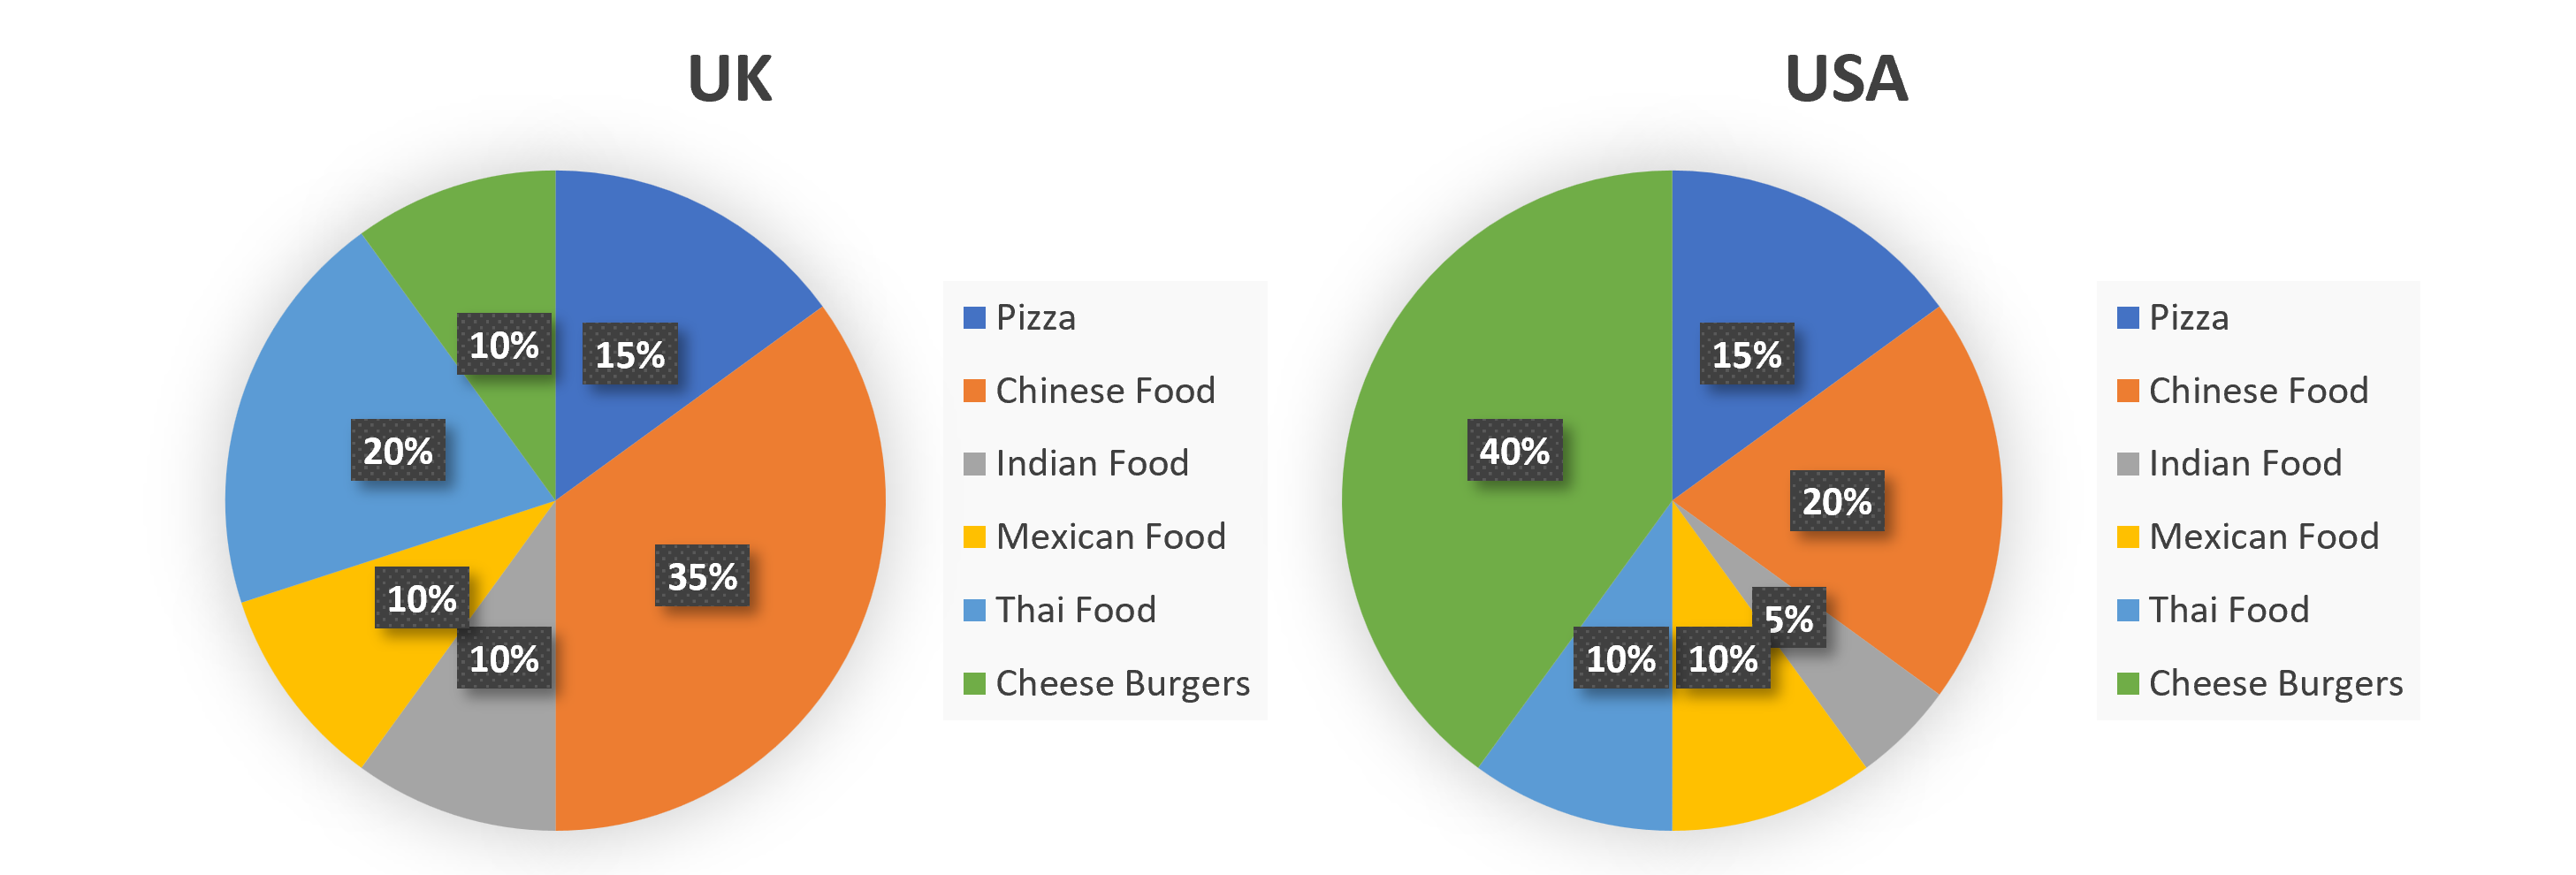
The pie charts show the percentage of people in the UK and USA who favour different types of fast food.
Summarize the information by selecting and reporting the main features, and make comparisons where relevant.
Write at Least 150 words
Look at the sample task above and then answer the following questions:
1. Do these charts represent information from a specific year?
Question 2 of 13
2. Question
2. What tense or tenses would you answer in? Select all that apply.
Question 3 of 13
3. Question
3. How much time should you spend on this task?
Question 4 of 13
4. Question
Sample Answer
The two pie charts give information about people’s favourite types of fast food in the UK and the USA. In summary, most people in the UK stated that Chinese food is their favourite kind of food, while cheeseburgers are the most popular in the USA.
An examination of the charts reveals several differences between the two nations’ fast-food preferences. For instance, cheeseburgers are the most popular among people in the USA, accounting for 40% of all responses, whereas the proportion of people who favour cheeseburgers in the UK is a quarter of this figure. Chinese food is the most popular in the UK, at 35%, which is 15% higher than the figure for the USA. Additionally, 10% of UK respondents answered that Indian food is their favourite, but the figure is half in the US, making it the least popular type of fast food.
On the other hand, there are some noticeable similarities between the two countries’ food preferences. To begin, 10% of American and British people stated that Mexican Food is their favourite. Likewise, 15% of respondents in both countries said that pizza is their favourite kind of food.
Read the sample answer and answer the following questions:
4. How many paragraphs make up this report?
Question 5 of 13
5. Question
5. The second and third paragraph start with a topic sentence. What is the purpose of these sentences?
Question 6 of 13
6. Question
6. Does this report describe trends, make comparisons, or do both?
Question 7 of 13
7. Question
7. Match the content to the paragraph
Sort elements
Description of the chart and summary of the data.
Differences
Similarities
Introduction
Main Paragraph 1
Main Paragraph 2
Question 8 of 13
8. Question
8. Is the introductory summary supported by specific figures?
Question 9 of 13
9. Question
9. Is every figure reported in the sample answer?
Question 10 of 13
10. Question
For instance, cheeseburgers are the most popular among people in the USA, accounting for 40% of all responses, whereas the proportion of people who favour cheeseburgers in the UK is a quarter of this figure.
Look at the sentence above and answer the following question:
10. What tense is it written in?
Question 11 of 13
11. Question
To begin, 10% of American and British people stated that Mexican Food is their favourite. Likewise, 15% of respondents in both countries said that pizza is their favourite kind of food.
Look at the sentences above and answer the following question:
11. What tenses are used in the sentences?
Question 12 of 13
12. Question
To begin, 10% of American and British people stated that…
12. Why is the past simple used in this clause?
Question 13 of 13
13. Question
…Many people stated that Mexican Food is their favourite.
12. Why is the present simple used in the clause in italics?
Report
There was a problem reporting this post.
Block Member?
Please confirm you want to block this member.
You will no longer be able to:
See blocked member's posts
Mention this member in posts
Invite this member to groups
Message this member
Add this member as a connection
Please note:
This action will also remove this member from your connections and send a report to the site admin.
Please allow a few minutes for this process to complete.